

摘要:
世界知识产权组织发布的《世界知识产权指标》(WIPI)报告显示,2021年当地专利申请量增长强劲。
#本文仅代表作者观点,不代表IPRdaily立场,未经作者许可,禁止转载#
“世界知识产权组织发布的《世界知识产权指标》(WIPI)报告显示,2021年,世界各地的创新者提交了340万件专利申请,同比增长3.6%,亚洲各主管局受理的申请量占全世界总申请量的67.6%。在中国(+5.5%)、大韩民国(+2.5%)和印度(+5.5%),2021年当地专利申请量增长强劲,推动了全球专利申请量的增长,促使亚洲申请量所占份额超过了三分之二的门槛。”
WIPO China: World Intellectual Property Indicators Report 2022 | Worldwide IP Filings Reached New All-Time Highs in 2021, Asia Drives Growth

图:WIPO | Photo : WIPO
2021年,全球专利、商标和外观设计的知识产权申请量创下新高,展现了全球创新生态系统在2019冠状病毒病大流行期间的韧性。
Global intellectual property (IP) filings for patents, trademarks and designs reached new heights in 2021, showing the resilience of the global innovation ecosystem during the COVID-19 pandemic.
世界知识产权组织发布的《世界知识产权指标》(WIPI)报告显示,与以往经济衰退的趋势相反,在2020年的2019冠状病毒病大流行高峰期,知识产权申请量依然强劲,并在2021年实现飙升。
Bucking the trend from previous economic downturns, IP filings remained strong during the height of the COVID-19 pandemic in 2020 and soared in 2021, WIPO's World Intellectual Property Indicators (WIPI) report showed.
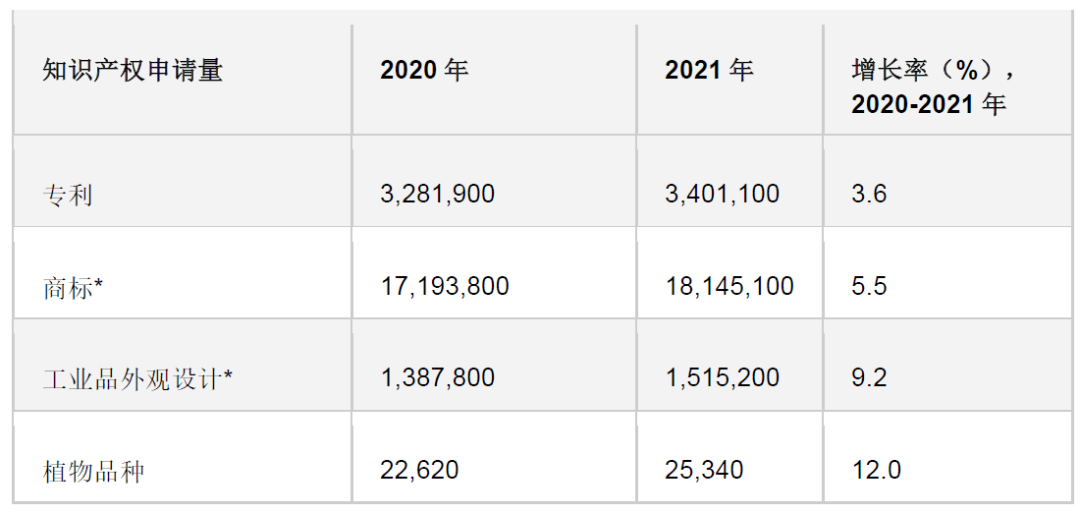
2021年,世界各地的创新者提交了340万件专利申请,同比增长3.6%,亚洲各主管局受理的申请量占全世界总申请量的67.6%。
Innovators around the world filed 3.4 million patent applications in 2021, up 3.6% from the previous year with offices in Asia receiving 67.6% of all applications worldwide.
在中国(+5.5%)、大韩民国(+2.5%)和印度(+5.5%),2021年当地专利申请量增长强劲,推动了全球专利申请量的增长,促使亚洲申请量所占份额超过了三分之二的门槛。美国(-1.2%)、日本(-1.7%)和德国(-3.9%)的当地专利申请活动量在2021年有所下降。
Strong growth in local patent filings in China (+5.5%), the Republic of Korea (+2.5%) and India (+5.5%) drove the global growth in patent applications in 2021, propelling the share of Asian filings to cross the two-thirds threshold. Local patenting activity in the U.S. (-1.2%), Japan (-1.7%) and Germany (-3.9%) declined in 2021.
2021年,大多数国家的商标申请活动量实现增长,全球商标按类计达到1,810万,同比增长5.5%。新品牌注册的增长恰逢大流行病的混乱所引发的创业活动和风险投资交易的盛行。工业品外观设计申请活动量增加9.2%。亚洲各主管局的外观设计申请量增长最大。
Most countries registered increases in trademark filing activity in 2021, with 18.1 million trademark class counts worldwide in 2021, up 5.5% on 2020. This growth in registering new brands coincided with a boom in entrepreneurial activity and venture capital deals prompted by the pandemic's disruptions. Industrial design filing activity rose by 9.2%. The largest growth in designs was also from offices in Asia.

关于2022年世界知识产权指标
About the World Intellectual Property Indicators – 2022

注:*表示申请中包含的商标类别和外观设计数可以进行跨境比较,因为某些国家要求为每个类别或每项外观设计提交独立的申请,而另一些国家允许在一份申请中包含多个类别/多项外观设计。
Note: * indicates trademark classes and designs contained in applications to allow for cross-border comparison, as some countries require individual filings for each class or design, while others allow for multiple classes/designs in a single filing.
专利 Patents
WIPI汇编了大约150个国家和地区知识产权的最新数据,发现中国的专利申请量大幅增长,大韩民国知识产权主管局和欧洲专利局也做出了有力的贡献。这些都是2021年全球增长的主要动力。
The WIPI, which compiles the latest data from some 150 national and regional IP, found a substantial rise in patent filings in China, combined with robust contributions from the IP office of the Republic of Korea and the European Patent Office. These were the main drivers of global growth in 2021.
在2021年全球范围内的总共340万件专利申请中,中国国家知识产权局在2021年受理了159万件专利申请,这一数量与排名第二至第十三的12个主管局的总和相近。紧随中国之后的是美国(591,473件)、日本(289,200件)、大韩民国(237,998件)和欧洲专利局(188,778件)的主管局。这五大主管局受理的申请数量共占世界总量的85.1%。
China’s IP office received 1.59 million patent applications in 2021 of the total 3.4 million filed worldwide in 2021, which is similar in magnitude to the combined total of the next 12 offices ranked from second to 13th. China was followed by the offices of the U.S. (591,473), Japan (289,200), the Republic of Korea (237,998) and the European Patent Office (188,778). Together, these five offices accounted for 85.1% of the world total.
在排名前二十位的主管局中,大部分——20家中的15家——在2021年受理的专利申请量高于2020年。增幅最大的是南非(+63.9%)、以色列(+18.3%)、墨西哥(+12.9%)、澳大利亚(+10.6%)和新加坡(+10%)——每家都报告有两位数的增长。在这五家主管局中,每一家的非居民申请的增加都是整体增长的主要动力。
The majority of the top 20 offices – 15 out of 20 – received a greater number of patent applications in 2021 than in 2020. The largest increases were in South Africa (+63.9%), Israel (+18.3%), Mexico (+12.9%), Australia (+10.6%) and Singapore (+10%) – each reporting double-digit growth. In every one of these five offices, an increase in non-resident filings was the principal driver of overall growth.
视频:WIPO | Video : WIPO
主要受中国长期增长的推动,亚洲各主管局在2021年受理的申请数量占全世界申请总量的三分之二(67.6%),相比2011年的54.6%有显著增加。北美各主管局受理的申请量占世界总量的18.5%,欧洲各主管局的占比略超十分之一(10.5%)。非洲、拉丁美洲和加勒比地区以及大洋洲各主管局的份额合计占2021年年全球总量的3.4%。
Offices located in Asia received two-thirds (67.6%) of all applications filed worldwide in 2021 – a considerable increase from 54.6% in 2011 – mainly driven by long-term growth in China. Offices located in North America accounted for 18.5% of the world total, while those in Europe accounted for just over one-tenth (10.5%). The combined share of offices located in Africa, Latin America and the Caribbean, and Oceania was 3.4% in 2021.
全球有效专利数量在2021年增长了4.2%,达到约1,650万件。中国的有效专利数量达到360万件,超过美国成为2021年有效专利数量最多的管辖区域。排在中国之后的是美国(330万件)、日本(200万件)、大韩民国(120万件)和德国(877,763件)。2021年,中国的有效专利数量增长最快(+17.6%),排在其后的是德国(+5.2%)和大韩民国(+5.2%)。
Patents in force worldwide grew by 4.2% to reach around 16.5 million in 2021. China surpassed the U.S. to become the top jurisdiction in terms of number of patents in force in 2021 – with 3.6 million. China was followed by the US (3.3 million), Japan (2 million), the Republic of Korea (1.2 million) and Germany (877,763). China (+17.6%) saw the fastest growth in patents in force in 2021, followed by Germany (+5.2%) and the Republic of Korea (+5.2%).
由于保密专利申请和公布期之间的时间延迟,2021年的技术类型排名尚不得而知。但在2020年——该年度是可以获得完整数据的最近一年——计算机技术是全球已公布专利申请中出现频率最高的技术领域,占所有已公布申请的十分之一(10.2%),位列其后的领域是电气机械(6.5%)、测量(5.7%)、数字通信(5.1%)和医疗技术(5%)。
Due to the delay between the filing of a confidential patent application and publication, the ranking of types of technology is not yet available for 2021. But in 2020 – the latest year for which complete data are available – computer technology was the most frequently featured technology in published patent applications worldwide, accounting for one-tenth (10.2%) of all published applications followed by electrical machinery (6.5%), measurement (5.7%), digital communication (5.1%) and medical technology (5%).
商标 Trademarks
2021年,全球约有1,390万件商标申请,涵盖了1,810万个类别。申请中指定的类数在2021年显著增长了5.5%,连续第12年实现增长。在排名前20位的主管局中有18个主管局的商标申请活动量有所增长。
An estimated 13.9 million trademark applications covering 18.1 million classes were filed worldwide in 2021. The number of classes specified in applications grew by a remarkable 5.5% in 2021, marking a twelfth successive year of growth. Trademark filing activity grew in 18 of the top 20 offices.
事实上,有11个主管局在2021年实现了两位数的增长,从大韩民国的12.7%到联合王国的61.8%不等。各主管局的增长来源不同。例如,国内申请的增长推动了巴西、印度和土耳其的整体增长,而国外申请的增长主要促成了加拿大、瑞士和联合王国的总增长。
In fact, 11 offices recorded double-digit growth in 2021, ranging from 12.7% in the Republic of Korea to 61.8% in the UK. Source of growth varied across offices. For example, growth in domestic filings drove the overall growth in Brazil, India and Türkiye, while increase in foreign filings mainly contributed to the total growth in Canada, Switzerland and the UK.
中国国家知识产权局申请活动数量最多,按类统计约950万件;其次是美国专利商标局(899,678)、欧洲联盟知识产权局(欧盟知识产权局;497,542),以及印度(488,526)和联合王国(450,815)的主管局。
China’s IP office had the highest volume of filing activity with a class count of around 9.5 million; followed by the USPTO (899,678), the European Union Intellectual Property Office (EUIPO) (497,542), and the offices of India (488,526) and the UK (450,815).
亚洲各主管局占2021年所有商标申请活动量的69.7%,高于2011年的44.7%。欧洲所占份额从2011年的31.6%下降到2021年的15.7%。北美占2021年世界总量的5.9%,而位于非洲、拉丁美洲和加勒比地区以及大洋洲的主管局在2021年的合计份额为8.7%。
Offices located in Asia accounted for 69.7% of all trademark filing activity in 2021, up from 44.7% in 2011. Europe’s share declined from 31.6% in 2011 to 15.7% in 2021. North America accounted for 5.9% of the world total in 2021, while the combined share of offices located in Africa, Latin America and the Caribbean, and Oceania was 8.7% in 2021.
研究和技术是2021年申请人在国外寻求商标保护最多的行业部门,占所报告的全球非居民商标申请量的20%。其次是卫生(13.8%)、服装及配饰(12.8%)以及休闲和教育(10.5%)部门。与家用设备(9.7%)、农业(9.6%)和商业服务(9.5%)相关商标占总数的份额排名紧随其后。
Research and technology was the top sector in which applicants sought trademark protection abroad in 2021, accounting for 20% of the global non-resident trademark filing reported. It was followed by the health (13.8%), clothing and accessories (12.8%) and leisure and education (10.5%) sectors. Trademarks relating to household equipment (9.7%), agriculture (9.6%) and business services (9.5%) accounted for the next largest shares of the total.
据估计,2021年149个知识产权局约有7,370万件有效商标注册——比2020年增长14.3%,其中仅中国就有3,720万件,其次是美国,有280万件,印度有260万件。
There were an estimated 73.7 million active trademark registrations at 149 IP offices in 2021 – up 14.3% on 2020, with 37.2 million in China alone, followed by 2.8 million in the U.S., and 2.6 million in India.
工业品外观设计 Industrial designs
2021年,全球共提交了约120万件工业品外观设计申请,其中包含150万项外观设计。2021年,外观设计的数量增长了9.2%。2021年,中国国家知识产权局受理的申请中包含了805,710项外观设计,占世界总量的53.2%。其次是欧盟知识产权局(117,049项)、联合王国(74,781件)、大韩民国(69,248件)和土耳其(65,924件)。由于联合王国脱欧,联合王国主管局在2021年受理的外观设计申请比2020年增加了2.3倍,是外观设计申请数量方面在2021年第三活跃的主管局,一年内在世界排名中上升了四位。
An estimated 1.2 million industrial design applications containing 1.5 million designs were filed worldwide in 2021. The number of designs grew by 9.2% in 2021. China’s IP office received applications containing 805,710 designs in 2021, corresponding to 53.2% of the world total. It was followed by the EUIPO (117,049), the UK (74,781), the Republic of Korea (69,248) and Türkiye (65,924). Due to Brexit, the office of the UK received 2.3 times more designs in applications in 2021 than in 2020, making it the third most active office in terms of application design count in 2021, up four positions in the world ranking within a year.
在排名前二十的主管局中,联合王国(+128.5%)、印度(+67.6%)、墨西哥(+38.4%)和土耳其(+38.3%)在2021年的外观设计申请活动量增长强劲。非居民申请活动的增加推动了墨西哥和联合王国的整体增长,而居民申请活动量的增加是印度和土耳其总增长的主要来源。
Among the top 20 offices, the UK (+128.5%), India (+67.6%), Mexico (+38.4%) and Türkiye (+38.3%) recorded strong growth in design filing activity in 2021. Increase in non-resident filing activity drove the overall growth in Mexico and the UK, while an increase in resident filing activity was the main source of the total growth for India and Türkiye.
2021年,亚洲各主管局在全球所有外观设计申请中占69.3%,高于2011年的64.1%。欧洲的份额从2011年的28.9%下降到2021年的23.3%。2021年,非洲、拉丁美洲和加勒比地区以及大洋洲的合计份额为7.4%。
Offices located in Asia accounted for 69.3% of all designs in applications filed worldwide in 2021, up from 64.1% in 2011. Europe’s share declined from 28.9% in 2011 to 23.3% in 2021. The combined share of Africa, Latin America and the Caribbean, North America and Oceania was 7.4% in 2021.
2021年,全球范围内的有效工业品外观设计注册总量增长了10.9%,达到约530万项。有效注册数量最多的是中国(260万项),其次是大韩民国(388,500项)、美国(381,549项)、欧盟知识产权局(268,150项)和日本(263,274项)。
The total number of industrial design registrations in force worldwide grew by 10.9% in 2021 to reach around 5.3 million. The largest number of registrations in force was in China (2.6 million), followed by the Republic of Korea (388,500), the U.S. (381,549), the EUIPO (268,150) and Japan (263,274).
2021年,全球申请活动中占比最大的是与家具和家居用品有关的外观设计(17.8%),其次是纺织品和配件(14.7%)、工具和机械(11.8%)、电力和照明(9.9%)以及信通技术和音像业(8.5%)。
Designs related to furniture and household goods (17.8%) accounted for the largest proportion of global filing activity in 2021, followed by textiles and accessories (14.7%), tools and machines (11.8%), electricity and lighting (9.9%), and ICT and audiovisual (8.5%).
植物品种 Plant varieties
2021年,全球共提交了约25,340项植物品种申请,较2020年增长了12%。中国主管局在2021年受理了11,195份植物品种申请,相当于全球总量的44.2%。排在中国之后的是欧洲联盟共同体植物品种局(CPVO;3,480件)以及美国(1,902件)、乌克兰(944件)和荷兰(836件)的主管局。
Around 25,340 plant variety applications were filed worldwide in 2021, up +12% on 2020. China’s relevant office received 11,195 plant variety applications in 2021, corresponding to 44.2% of the world total. China was followed by the Community Plant Variety Office of the European Union (CPVO; 3,480) and relevant offices of the U.S. (1,902), Ukraine (944) and the Netherlands (836).
在排名前五的主管局中,中国(+24.9%)和美国(+32.8%)在2020年到2021年间的申请量呈现两位数的增长,而乌克兰(-25.1%)在同一时期受理的申请量大幅减少。
Among the top five offices, China (+24.9%) and the U.S. (+32.8%) saw double-digits growth in filings between 2020 and 2021, while Ukraine (–25.1%) received considerably fewer applications over the same period.
地理标志 Geographical indications
来自93个国家和地区主管局的数据显示,2021年共有约63,600个受保护的有效地理标志。地理标志是用于具有特定地理来源且具有源于该产地的品质或声誉的产品的标志,例如用于奶酪的格吕耶尔(Gruyère)或用于烈酒的龙舌兰(Tequila)。
Data from the 93 national and regional authorities show there are an estimated 63,600 protected geographical indications (GIs) in existence in 2021. GIs are signs used on products that have a specific geographical origin and possess qualities or a reputation that are due to that origin, such as Gruyère for cheese or Tequila for spirits.
中国(9,052个)报告的有效地理标志数量最多,其次是匈牙利(7,743个)、捷克共和国(6,272个)、斯洛伐克(6,112个)以及波斯尼亚和黑塞哥维那(6,087个)。欧盟国家取得如此高的排名,是因为通过欧盟区域体系生效的5,076个地理标志在每个成员国都是有效的。
China (9,052) reported the largest number of GIs in force, followed by Hungary (7,743), the Czech Republic (6,272), Slovakia (6,112) and Bosnia and Herzegovina (6,087). The high rankings achieved by EU countries is due to the fact that the 5,076 GIs in force through the EU regional system are in force in every member state.
与“葡萄酒和烈酒”有关的有效地理标志占2021年世界总量的51%左右,其次是农产品和食品(43.6%)以及手工艺品(3.9%)。
GIs in force relating to “wines and spirits” accounted for around 51% of the 2021 world total, followed by agricultural products and foodstuffs (43.6%) and handicrafts (3.9%).
(原标题:WIPO 中国:2022年《世界知识产权指标》报告 | 2021年全球知识产权申请量创历史新高,亚洲推动增长)
点击“阅读原文”,查看关于《世界知识产权指标》(WIPI)报告更多信息。
来源:WIPO中国
编辑:IPRdaily赵甄 校对:IPRdaily纵横君
注:原文链接:WIPO 中国:2022年《世界知识产权指标》报告 | 2021年全球知识产权申请量创历史新高,亚洲推动增长(点击标题查看原文)

「关于IPRdaily」
IPRdaily是全球领先的知识产权综合信息服务提供商,致力于连接全球知识产权与科技创新人才。汇聚了来自于中国、美国、欧洲、俄罗斯、以色列、澳大利亚、新加坡、日本、韩国等15个国家和地区的高科技公司及成长型科技企业的管理者及科技研发或知识产权负责人,还有来自政府、律师及代理事务所、研发或服务机构的全球近100万用户(国内70余万+海外近30万),2019年全年全网页面浏览量已经突破过亿次传播。
(英文官网:iprdaily.com 中文官网:iprdaily.cn)
本文来自WIPO中国并经IPRdaily.cn中文网编辑。转载此文章须经权利人同意,并附上出处与作者信息。文章不代表IPRdaily.cn立场,如若转载,请注明出处:“http://www.iprdaily.cn”


